每周全球金融观察 |第 156 篇:2024 年三连胜指标不能达成
来源:岭南论坛 时间:2024-01-08
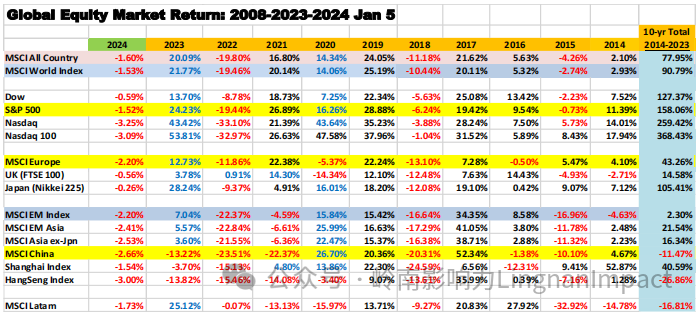
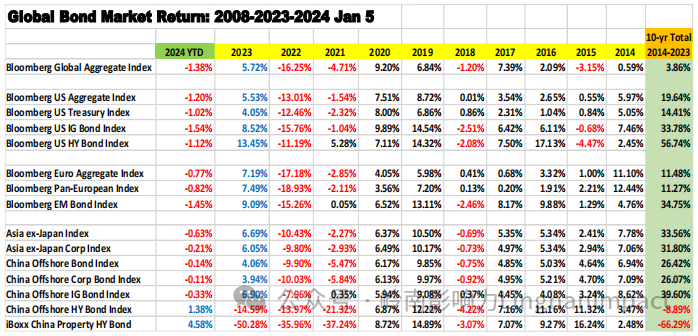
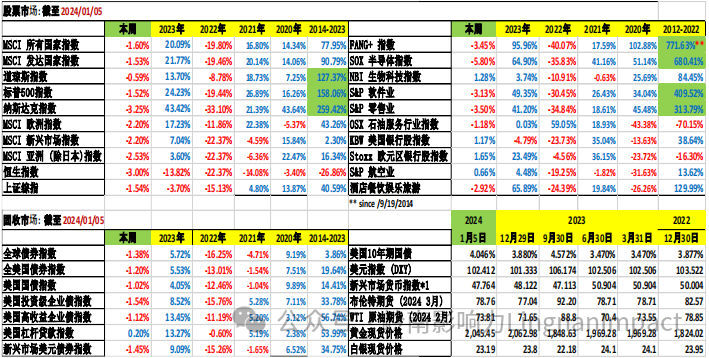
本周,新年伊始,大多数市场参与者都沉浸在喜悦之中。许多人回忆起前两个月的辉煌市场,道琼斯指数、标准普尔指数和纳斯达克指数连续 9 周上涨,固定收益市场也创下了几十年来最好的两个月表现。11 月和 12 月的市场繁荣在本周戛然而止。取而代之的是一盆冷水,迎接醉醺醺的多头们的是 2003 年以来最糟糕的新年开局。2024 年头 4 个交易日,标普 500 指数和纳斯达克综合指数分别下跌了 1.52% 和 3.25%。彭博全球综合指数和美国综合债券指数在四个交易日内分别下跌了 1.38% 和 1.20%。发生了什么?

不可否认,市场在 11 月和 12 月领先圣诞老人和美联储(以及欧洲央行),对未来大幅降低利率的预期过于不切实际。也许美联储有向市场发出降息信号的嫌疑。一个明显的危险是,美联储可能承诺过多,很可能兑现不足。
此外,由于指数化, 相对回报, 和年终投资组合再平衡的特殊性(或者说 2023 年年终缺乏再平衡,在牛市持续运行到 12 月的情况下,没有人愿意在最后一刻冒着再平衡的风险而危及表现出色的一年)。相反,投资组合重新平衡和行业轮换是在 2023 年第一周进行的。
为了加剧今年第一周的抛售,周三公布的 FOMC 会议纪要(12 月会议纪要)让宿醉的多头们开始清醒。尽管美联储在 2023 年的最后一次政策会议上确实同意利率可能处于峰值,而且几乎所有人都预测降低利率 "在 2024 年底之前是合适的",但会议并未讨论究竟何时可以开始降息,与会者还保留了在通胀再次升温的情况下提高利率的选项。对于利率 "在较高水平上维持多久 "也存在一些分歧。这让市场对 2024 年降息 150 个基点(3 月份将开始降息 )的预期又回到了现实(或理智)的检查中。
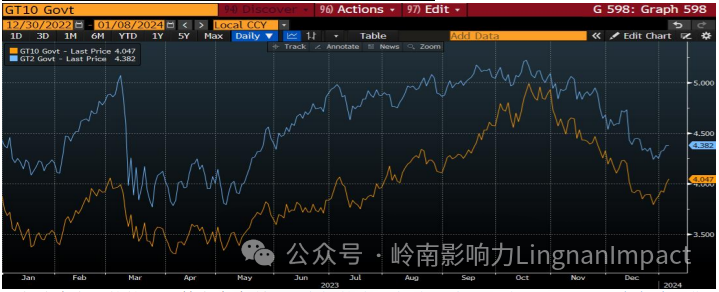
顺便提一下,2023 年初 10 年期美国国债收益率为 3.88%,2023 年末正好是 3.88%。2024 年第一周的收益率突破了 4.00%,以 4.05% 结束。
自 2023 年以来的 2 年期和 10 年期美国国债收益率:

正如我在上周的第 155 篇文章中所写:市场的欢呼声需要缓和。预计 2022/2023 年加息周期已经结束是现实的,但大规模降息的预期是非理性的。降息的速度和幅度将比 2022/2023 年加息的速度和幅度要慢得多,也小得多。
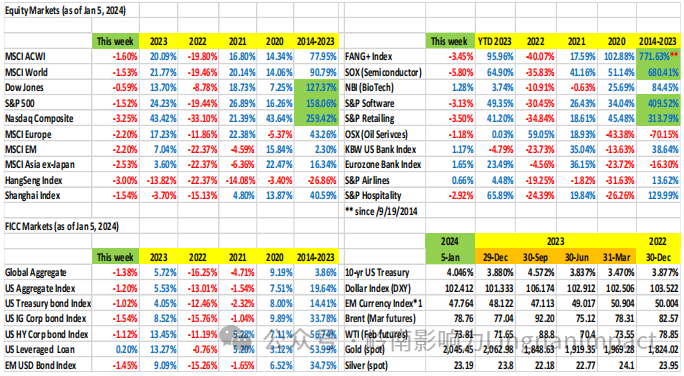
请参阅下表,了解 2024 年第一周与 2023 年第一周以及前一年的业绩对比:
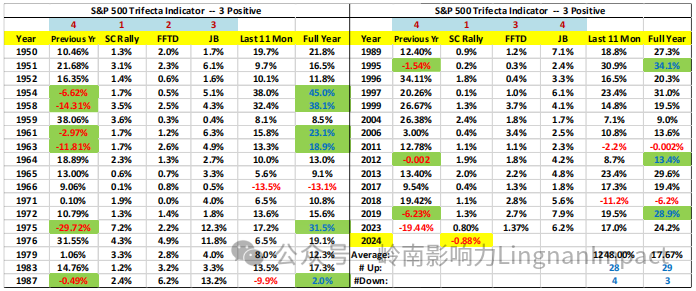
三连胜指标要求满足所有 3 个变量(圣诞老人反弹、FFTD 前 5 个交易日和一月晴雨表)。三连胜指标的第一个变量在 2024 年未能实现。无需等待第二和第三个变量的结果。
关注我市场展望的 "粉丝 "们应该还记得,我在 2 月 1 日(2023 年)上午 8 点 16 分在我的 "微信粉丝群 "里发了一条微信,宣称 2023 年达到三连板指标,2023 年美国股市收高(以标普500 为基准)的概率为 90%至 100%。标准普尔 500 指数在 2023 年上涨了 24.23%。
要明确的是,三连胜指标并不是股市走高的先决条件。它只是一个大数据概率指标。总有其他因素和技术畸变。
2020 年没有达到 "三连胜 "指标。第一个和第二个变量得到了满足,但第三个变量没有。虽然标普 500 指数在 2020 年上涨了 16.26%,但从 2 月 19 日到 3 月 23 日,标普指数暴跌了 34%,原因是 Covid-19 爆发并经济封锁。正是史无前例的货币宽松政策和财政刺激政策避免了这场灾难。2021 年没有达到三连胜指标。标准普尔 500 指数在 2021 年全年表现稳定,全年涨幅为 26.89%。
我们还记得,纳斯达克 100 指数在 2023 年上涨了 53.81%(1999 年以来涨幅最大的一年),这主要是由 "伟大的七豪勇" 推动的。截至 12 月 31 日,"伟大的七豪勇"占纳斯达克 100 指数权重的 61%,占纳斯达克综合指数权重的 49%,占标准普尔 500 指数权重的 30%。随着资金不断涌入 ETF 和被动投资,主动型经理人不希望在年底前降低 "伟大的七豪勇" 在指数的权重,从而面临业绩不佳的风险。
游戏于 2024 年 1 月 2 日重置。今年的第一个交易日,"伟大的七豪勇"七只股票全部下跌(苹果下跌 3.6%,Nvidia 下跌 2.7%)。周三(第二个交易日)再次出现下跌,这在技术上决定了指数和三连胜指标的命运(只是数学和百分比)。
我想指出的是,标普 500 指数在 2023 年上涨了 24.23%。在标普 500 指数的历史上,在熊市(2022 年)之后的一年(2023 年)涨幅达到 20%,接下来的一年平均涨幅为 9.7%。
尽管如此,2023 年的钱还是赚得很容易(有人称之为 "运气钱")。2024 年和(2025 年?)贝塔尾风是有限的(能够抓住它总是好的)。期待波动,期待资产类别和行业轮换,并做好努力赚钱的准备。
作者:蔡清福
Alvin C. Chua
2024 年 1 月 7 日星期日
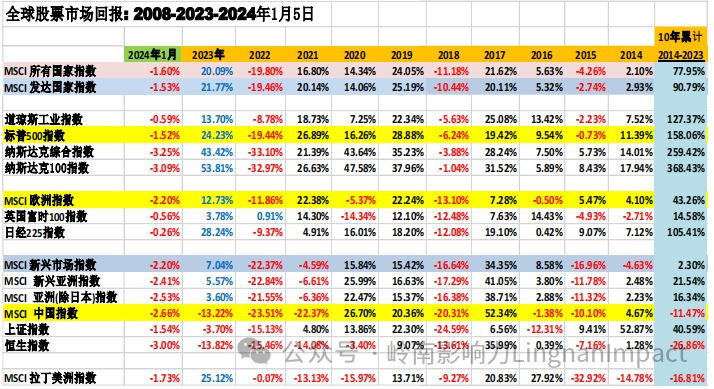
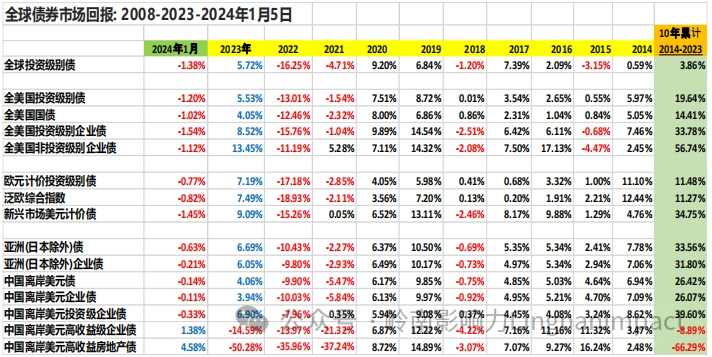
Most market participants were in a state of jubilation as the new year got started this week.Many reminisced about the fabulous markets of the previous two months, whereby the Dow,S&P and Nasdaq made 9 consecutive weeks of gains, and the fixed income market had the besttwo-month performance in decades. The market exuberance in November and December cameto an abrupt halt this week. Instead, what greeted the intoxicated bulls were buckets of coldwater, with the worst new year kick-off since 2003. For the first 4 trading days in 2024, the S&P500 Index and the Nasdaq Composite Index fell 1.52% and 3.25% respectively. The BloombergGlobal Aggregate Index and the US Aggregate Bond Index fell 1.38% and 1.20% respectively in four trading days. What happened?
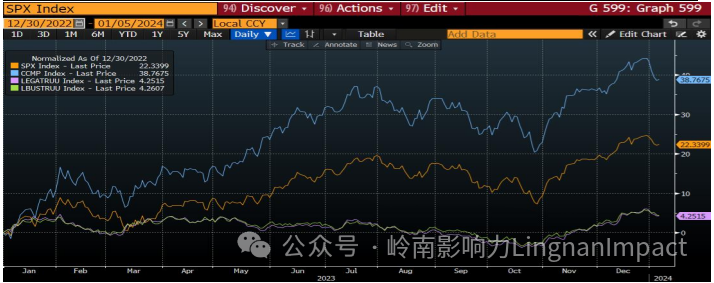
Nasdaq, S&P500, Global Aggregate, US Aggregate Bond index: cumulative % return since 2023:
Undeniably, the markets had front-ran Santa Claus and the Fed (as well as the ECB) in Novemberand December, with overly unrealistic expectations of significantly lower interest rates to come.Perhaps the Fed is guilty of signaling rate cuts to the market. There is a clear danger that the Fedmay have over-promised and is likely to under-deliver.
Additionally, with the idiosyncrasy of indexing, relative returns, and year-end portfolio rebalancing (or lack of, with a sustained bull run into December, no one wants to jeopardize a greatperforming year with last minute rebalancing risk). Instead, portfolio rebalancing and sectorrotation came in the first week of 2024.
To exacerbate the first week of the year sell-off, the FOMC minute (from the December meeting) released on Wednesday sent intoxicated bulls with heavy hangover into detox. As much as the Fed did agree during their last policy meeting in 2023 that interest rates were likely at their peak and almost all of them predicted “lower rates would be appropriate by the end of 2024”, there was not a discussion of exactly when those cuts should begin and participants kept the option of higher rates on the table if inflation were to heat up again. There was also some divergence about exactly how long rates could stay at “high level longer.” Which sent the market expectation of 150bp rate cuts in 2024 (with the first to come in March) back to reality (or sanity) check.
2-yr and 10-yr US Treasury yield since 2023:
As I wrote in article 155 last week: market jubilation needs to be toned down. It is realistic to expect that 2022/2023 rate hike cycle has concluded, but the expectation of massive interest rate cuts is irrational. The speed and magnitude of rate cuts will be much slower and smaller than the 2022/2023 rate hikes.
Please refer to the following table for first week 2024 vs 2023 and prior year performance:
Trifecta Indicator requires all 3 variables (Santa Claus rally, FFTD first 5-trading days, and Januarybarometer) to be met. The first variable of the Trifecta Indicator failed to be achieved in 2024.There is no need to wait for the outcomes of the 2nd and 3rd variables.
“Fans” who followed my market outlook would remember I sent a WeChat message to my“WeChat Fans group” at 8.16am on Feb 1 (2023), proclaiming Trifecta Indicator was met in 2023, and that the probability of the US stock market ending the year higher in 2023 (using the S&P500 as a benchmark) was 90% to 100%. The S&P 500 went up 24.23% in 2023.
To be clear, a Trifecta Indicator is not a prerequisite for a higher stock market. It is a big data probability indicator. There are always other factors and technical aberrations.
In 2020, the Trifecta Indicator was not met. The first and 2nd variables were met, but not the 3rd. Although the S&P500 gained 16.26% in 2020, the S&P plunged 34% from Feb 19 thru March 23, because of the Covid-19 outbreak and locked down. It was the unprecedented monetary easing and fiscal stimulus that averted the disaster.
The Trifecta Indicator was not met in 2021. The S&P 500 was steady throughout 2021, gaining 26.89% for the year.

We remember that the Nasdaq 100 gained 53.81% in 2023 (its best year since 1999), driven primarily by the Magnificent Sevens. As of Dec 31, the Mag-7s account for 61% of Nasdaq 100 index weighting, 49% for the Nasdaq composite, and 30% for the S&P500. As monies continue to pour into ETFs and passive investments, active managers would not want to underweight Mag7s to risk underperformance before year end.
The game resets on Jan 2, 2024. All seven of the Mag-7 declined on the first trading day of the year (Apple was down 3.6%, and Nvidia was down 2.7%). The decline repeated on Wednesday (the 2nd trading day), which technically sealed the fate of the indices and the Trifecta Indicator (just a matter of mathematics and percentages).
I would like to note that, the S&P 500 gained 24.23% in 2023. In the history of the S&P500, after a 20% one-year rally (2023) following a bear market (2022), has been followed by next year gains averaging 9.7%.
Nevertheless, the easy money has been made (some would call it dumb luck money) in 2023. 2024 and (2025?) would be hard work money. The beta tail-wind is limited (always good to catch it when there is one). Expect volatility, expect asset-class and sector-rotation, and be prepared to work hard to earn the money.